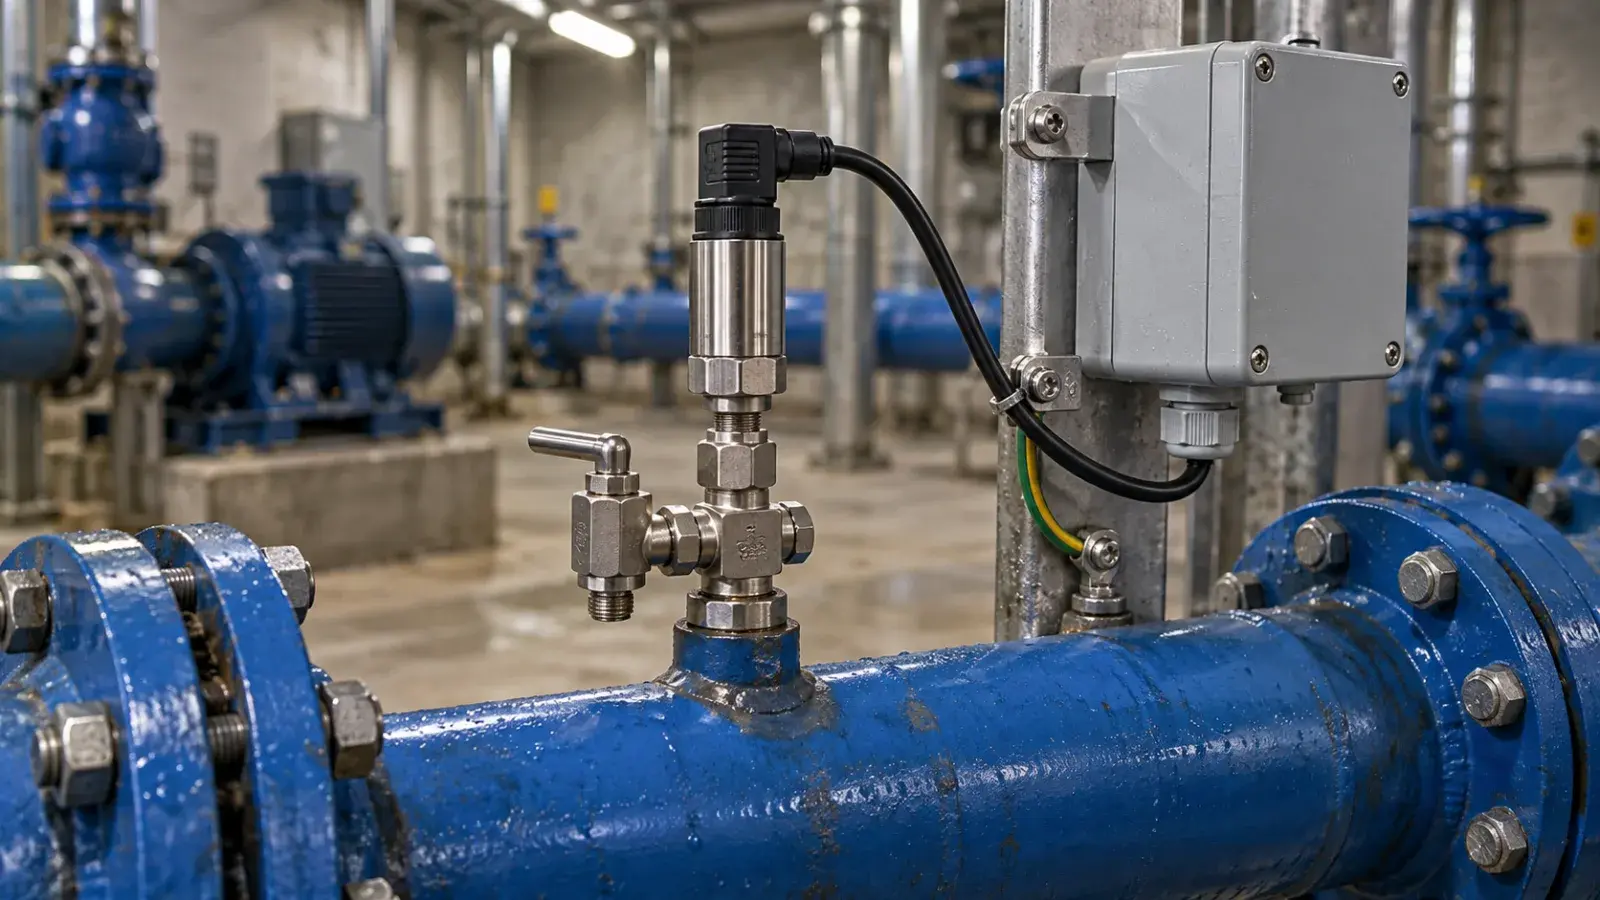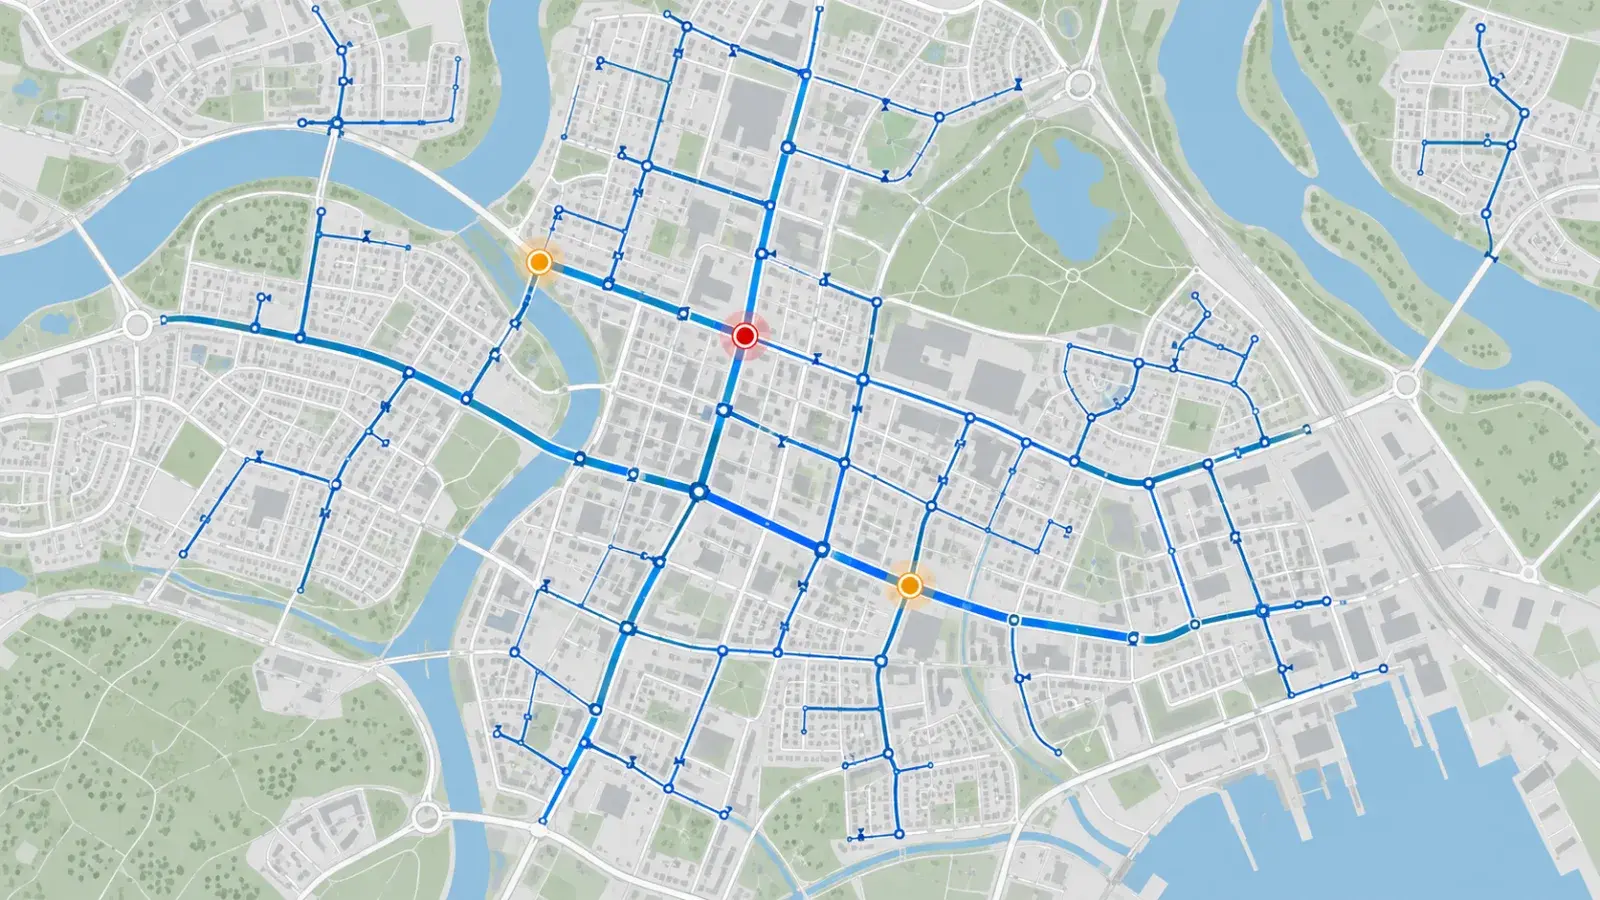
Start with measures whose records and denominators your team can explain: complete repair records, outstanding follow-up and consistently defined response times. A dashboard is useful only when the team understands what each number includes and leaves out.
Maintain has documented work-order, inspection and cost data areas. The measures below are original editorial definitions to validate against your configuration, not preconfigured Trimble KPI names. Connector data reference.
Write the definition before the chart
| Measure | Proposed definition | Decision it supports |
|---|---|---|
| Repair-record completeness | Reviewed repair records with required evidence ÷ reviewed repair records | Where documentation needs attention |
| Open corrective backlog | Corrective tasks still open at a stated snapshot time | What still needs ownership or action |
| Attendance interval | First attendance timestamp minus accepted report timestamp | Where response handoffs need review |
| Repeat confirmed interventions | Assets with another qualifying intervention in a defined period | Which histories need investigation |
Specify exclusions, period, timezone and data owner. Keep planned inspections separate from reactive repairs when comparing workloads.
Worked calculation
In a synthetic month, 20 repair records are reviewed. Sixteen contain the agreed asset identity, finding, completed action and review evidence. Completeness is 16 / 20 × 100 = 80%. This is a description of the example records, not a recommended performance target.
Suppose 30 caller reports relate to those 20 repairs. Dividing the 16 complete records by 30 would answer a different and misleading question. Likewise, do not describe 30 closed reports as 30 completed repairs.
For attendance, consider three example intervals of 30, 40 and 170 minutes. Their median is 40 minutes; their mean is 80 minutes. Both are correct summaries, but the longest case deserves investigation. Check whether its delay reflects a different incident type or a timestamp problem before comparing teams.
Keep missing data visible
If five records lack attendance times, do not silently calculate a response figure over the remainder as though it represents every case. Publish the coverage alongside the result: how many eligible records had usable timestamps? An improving metric with shrinking coverage can conceal a data problem.
Define backlog at a fixed snapshot and retain its age distribution. A smaller backlog may reflect valid completed work, cancelled duplicates or reclassification; those explanations should remain traceable.
Do these measures prove water savings?
No. Maintenance records can describe interventions, but a water-loss claim needs its own measurement method and evidence. Do not infer saved volume from work-order counts or faster administrative closure.
Use the water-network workflow to identify where the source timestamps and review evidence should originate. Test calculations on a small reviewed sample before relying on a dashboard.
Plan your next step
Review InfoGraph’s Trimble offering and GIS implementation services. Contact our team with a sample asset record and the decision you need the workflow to support. For GIS data and field-collection skills, explore the training catalogue and confirm the relevant course scope; a dedicated Maintain course is not assumed.