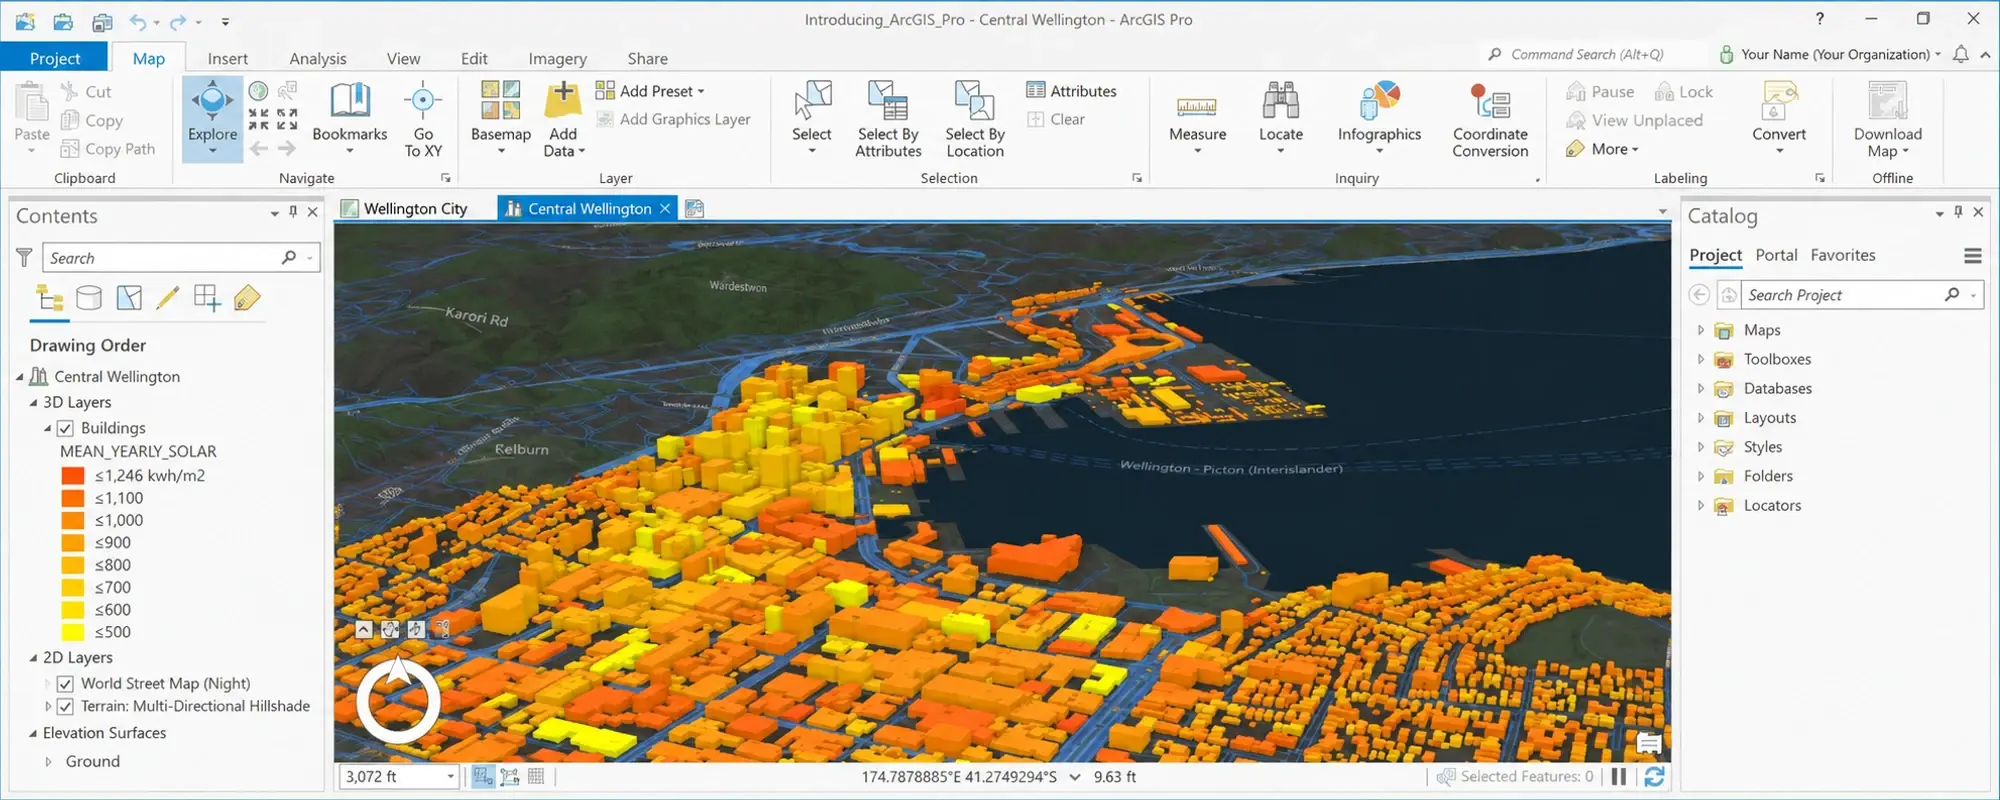
Start learning ArcGIS Pro with one small project: turn a table of facility coordinates into points, count those points by study area, and prepare a map explaining the result. This connects data preparation, mapping, analysis, and communication in a workflow you can repeat. Before starting, arrange access to ArcGIS Pro and check that your computer meets its requirements.
For a student or professional in Jordan, that could mean working with a practice dataset of schools, community centres, or field inspection locations. The goal is to complete a workflow you can repeat with different data.
Here is a manageable first project, from a table of locations to a map you can explain.
Start with one question
Use this as your learning brief: How many facilities in my dataset fall within each study area?
You will need a table of facility locations and a polygon layer defining the areas you want to compare. Use training data or a dataset you have permission to use, and record its source and date. If the locations are fictional, label the exercise accordingly.
Set three deliverables: a facility map, a table of counts by area, and a short explanation of the result’s limitations. That gives you a way to judge your progress beyond whether the software produced an output.
Turn your table into map features
Before opening a geoprocessing tool, inspect the table. Give each facility a unique identifier, look for missing coordinates, and check whether repeated rows represent duplicate records or different facilities at the same location.
ArcGIS Pro’s XY Table To Point tool creates a point feature class from coordinate fields. For longitude and latitude data, longitude is x and latitude is y. Specify the coordinate system that actually describes the source values; don’t choose one simply because it makes the points appear near your study area. Esri’s coordinate-data guidance.
After creating the points, inspect several known locations. A map that draws successfully can still contain misplaced data.
Make the map easy to read
Use a simple symbol for facilities and a quiet background. If your table includes facility types, distinguish a few meaningful categories without giving every record a different colour.
Keep area boundaries visible and label only what helps the reader understand the map. A useful check is to ask someone unfamiliar with the exercise what the symbols mean. If you need a long explanation, simplify the design.
Count facilities by area—and check the result
Use Spatial Join with the area polygons as target features and facility points as join features. For this exercise, select a one-to-one join, keep all target areas, and use Intersect as the spatial relationship. With a single point input, the output’s Join_Count field records matching facilities for each area. Esri’s Spatial Join documentation.
Check zero-count areas, boundary points, and overlapping polygons. A point may match multiple areas, or none. Investigate these cases before treating the total as a count of unique facilities.
Then explain the limits: facility counts alone do not measure service quality, capacity, travel time, or whether residents’ needs are met. Those questions need additional data and analysis.
Share an output someone else can use
Prepare a layout with a clear title, readable legend, data sources, and a note explaining what was counted. Add a brief conclusion that distinguishes what you observed from what you still need to investigate.
If your next step is a web map, ArcGIS Pro supports sharing to ArcGIS Online or ArcGIS Enterprise. Check the account privileges required for your chosen sharing configuration, resolve analyzer errors, and review the intended audience before sharing. Esri’s web-map sharing guidance.
For another guided exercise, try Esri’s Get started with ArcGIS Pro tutorial, then browse the Learn ArcGIS tutorial gallery for a task that matches your interests. Check the tutorial’s software and account requirements before starting, and compare its workflow with the decisions you made in your own project.
Use the project to choose your next training step
Notice where you needed the most help. Was it understanding coordinate systems, preparing the table, selecting the analysis settings, or interpreting the output? That difficulty gives you a practical training goal.
Esri distinguishes introductory GIS learning from ArcGIS Pro: Essential Workflows, which assumes basic GIS knowledge and develops skills in mapping, editing, analysis, and sharing. Esri’s foundational course guidance.
Explore InfoGraph’s GIS training catalogue, or read our guide to choosing a GIS training course in Jordan. You can also compare ArcGIS Pro and ArcGIS Online as learning starting points. If you are unsure where to begin, tell us about your experience and the work you want to do. A clear learning goal makes it easier to find an appropriate starting point.